Run durations
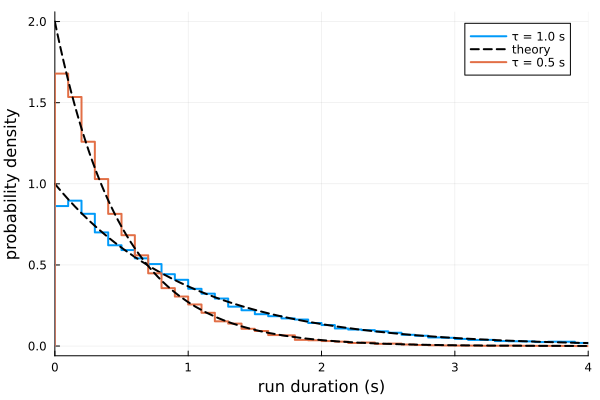
Switching between motile states is a Poisson process: a microbe in a run state of average duration $\tau$ leaves it with probability $\Delta t/\tau$ at each timestep. For $\Delta t \ll \tau$ the run durations are therefore exponentially distributed:
\[P(t) = \frac{1}{\tau} \exp(-t/\tau)\]
We will compare the run-length distributions of two populations with different average run durations against the exponential prediction.
using MicrobeAgents
using Plots

U = 30.0 # μm/s
Δt = 0.01 # s
L = 1e4 # μm
n = 200 # microbes per population
τs = (1.0, 0.5) # s
nsteps = round(Int, 100maximum(τs) / Δt)

space = ContinuousSpace((L, L, L))
model = StandardABM(Microbe{3}, space, Δt; container=Vector)
# instantaneous isotropic tumbles, no rotational diffusion:
# every change of direction marks the end of a run
for τ in τs, _ in 1:n
    add_agent!(model; motility=RunTumble([U], τ, Isotropic(3)))
end
adf, = run!(model, nsteps; adata=[velocity])
Analysis.detect_turns!(adf)
durations = Analysis.run_durations(adf)

plt = plot(
    xlab="run duration (s)", ylab="probability density",
    xlims=(0, 4maximum(τs)),
)
for (k, τ) in enumerate(τs)
    ids = (1:n) .+ (k-1)*n
    # the first run of each microbe started before the observation: discard it
    T = Δt .* reduce(vcat, [d[2:end] for d in durations[ids]])
    stephist!(plt, T, normalize=:pdf, bins=0:10Δt:10τ, lw=2, lc=k, label="τ = $τ s")
    plot!(plt, t -> exp(-t/τ)/τ, 0, 4maximum(τs), lw=2, ls=:dash, lc=:black, label=(k == 1 ? "theory" : false))
end
plt